Classification: IPTC: 04019000 • IAB-QAG: IAB13-3, IAB13
Please enjoy this #crypto content, These Two On-Chain Signals Precede Bitcoin Falls, Suggests Analyst
Originally reported on www.newsbtc.com by Hououin Kyouma, below.
NEWSer CHEWSer
An analyst has suggested that two on-chain signals may be used to predict Bitcoin falls as they seem to have historically preceded drops in the crypto’s price.
Bitcoin Selling Of 7yrs-10yrs Old Coins Spiked Up Recently
As pointed out by an analyst in a CryptoQuant post, BTC dumping of coins aged between 7 years to 10 years and ETH dominance rising up can be two signs to look for before falls in the coin’s value.
The first indicator of relevance here is the “Spent Output Age Bands,” which checks for on-chain movement of coins and tells us which age groups were responsible for them.
The different “coin age groups” in the market include coins based on the total amount of time they were sitting idle for before being moved or sold.
The group in question here is the “7 years to 10 years old” cohort. The Spent Output chart for this group, therefore, shows how many coins were moved that were previously sitting idle for periods in this range. Here is the graph for it:
The value of the metric seems to have spiked up in recent days | Source: CryptoQuant
As you can see in the chart, the quant has marked the relevant points of trend for this Bitcoin indicator as well as the corresponding BTC price.
The analyst explains that whenever the spending of the 7 years to 10 years age band exceeds 5000, BTC usually observes a downtrend in its value.
Out of the 7 times the signal was seen during the last few years, only once did the price not register a plunge down.
Ethereum Dominance Was Also Elevated In Recent Weeks
The other indicator that the analyst believes to be of note is the “ETH dominance,” which is a measure of the total crypto market cap percentage share for Ethereum.
The below chart shows the trend in this metric over the last few years.
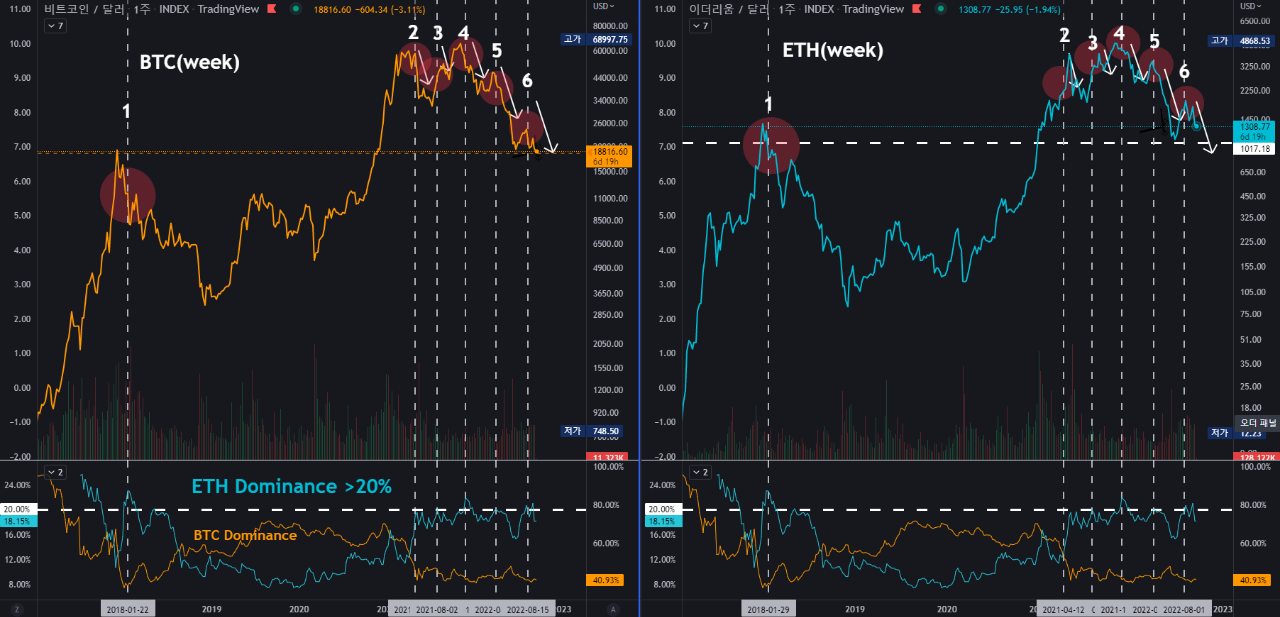
Looks like the value of the metric has been high recently | Source: CryptoQuant
It seems the Ethereum dominance exceeding the 20% mark has also been a bearish sign for Bitcoin during this period.
In conclusion, the analyst suggests that proper use of these two indicators in conjunction may help investors prepare for downtrends in the future.
At the time of writing, Bitcoin’s price floats around $18.7k, down 16% in the last seven days. Over the last month, the crypto has lost 18% in value.
The below chart shows the trend in the price of the coin over the last five days.

BTC's value has plunged down over the last day | Source: BTCUSD on TradingView
Featured image from Bastian Riccardi on Unsplash.com, charts from TradingView.com, CryptoQuant.com
‘News of the Day’ content, as reported by public domain newswires.
Source Information (if available)
It appears the above article may have originally appeared on www.newsbtc.com and has been shared elsewhere on the internet, repeatedly. News articles have become eerily similar to manufacturer descriptions.
We will happily entertain any content removal requests, simply reach out to us. In the interim, please perform due diligence and place any content you deem “privileged” behind a subscription and/or paywall.
First to share? If share image does not populate, please close the share box & re-open or reload page to load the image, Thanks!