Why Bitcoin Could See A 2020 Like Rally
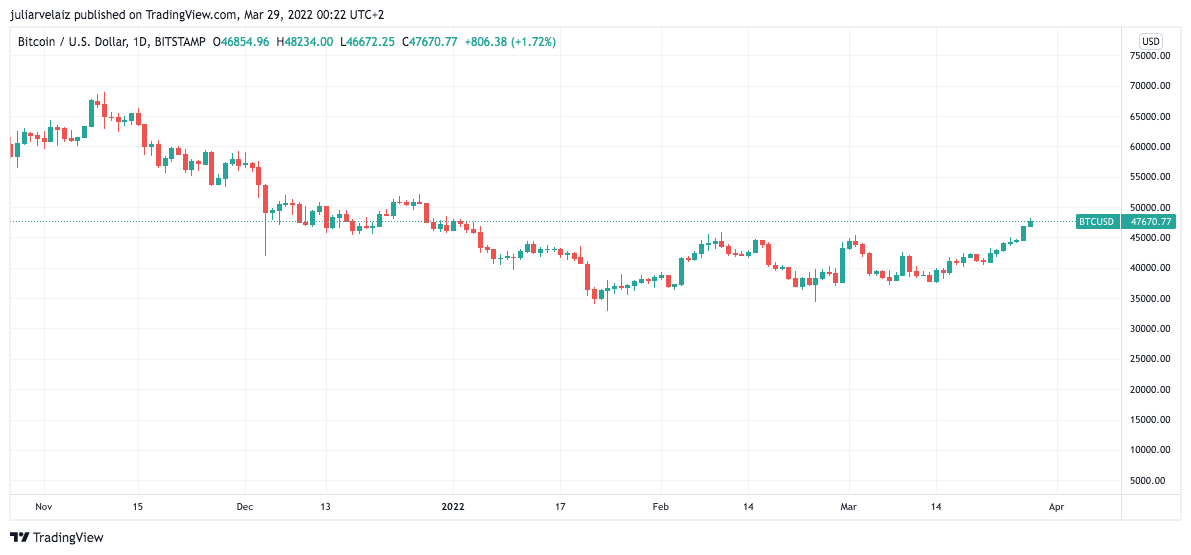
After a rough couple of months, this week started with a strong upward movement from Bitcoin as the coin broke out above the $45,000 level on Monday to $48,215 before fluctuation, thus erasing yearly losses and anticipating a $50,000 target.
Despite the decline over the year, a large amount of the coin was never sold. A scenario that shows how holders strongly believe in the long-term game and remain surprisingly calm over a period of turmoil.
Building Up To A Rally
Senior Analyst Dylan LeClair noted that, as Bitcoin is trading at around $48,000, “there has only been one other time that the percentage of supply that hadn’t moved in over a year was at this level,” which was during September 2020.
On the mentioned date Bitcoin recovered from the dramatic crash of march 2020. The strong bounceback saw a 185% hike in the prices, taking to coin to over $10,000. A high number of committed ‘hodlers’ had also kept their BTC dormant despite the extreme swings in prices during the year.
This was followed by a performance that catapulted Bitcoin’s reputation amongst investors as “digital gold”. It closed the year trading at record highs of close to $30,000, outperforming gold with an increase of 416% over the year.
Brett Munster at Blockforce Capital had also noted last week a near-record highs percentage of the total Bitcoin supply that hasn’t moved in over a year, further pointing out that it is growing at a much faster pace than the last time Bitcoin was at these levels.
“I expect this number to set new all-time highs in coming weeks and months because it’s exactly this cohort that stepped in and aggressively bought in April and May of last year when Bitcoin’s price fell.”

Related Reading | Bitcoin Likely To Continue Upward Trajectory, Is $50K Its Next Target?
Bitcoin Derivatives Paint A New Picture
Furthermore, Dylan LeClair also noted that BTC derivatives “are still somewhat defensive & nowhere near as risk-on as 2021 despite same price levels.”
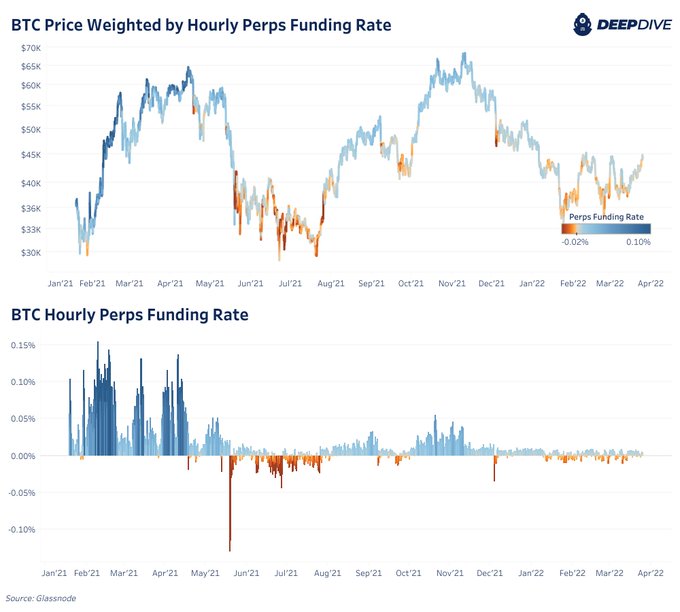
Illustrated by the following chart, the analyst showed the movement of BTC derivatives throughout 2021 “when the price was trading at this current level.”
Note that funding rates “represent traders’ sentiments in the perpetual swaps market,” with positive funding rates (over 0) indicating that long position traders are dominant and negative funding rates (under 0) indicating the opposite, CryptoQuant explains.
Compared to previous years, the BTC hourly perpetual funding rates are significantly closer to zero. “Excessive long-biased derivative market speculation is near non-existent currently,” says LeClair.
What the analyst is pointing out means that excessive speculation and leverage drove the market to these price levels in 2021, and “now its basically nowhere to be seen and bitcoin is rallying.” This could imply that the price is now rising because of demand, not market speculation.
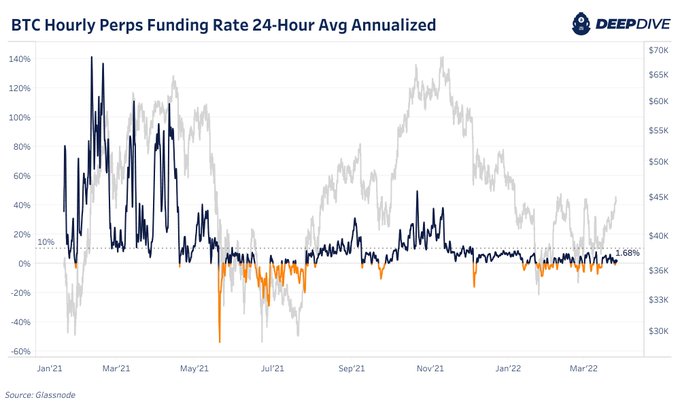
Similarly, in the following chart, LeClair displays annualized perpetual future funding rates on a 24-hour Moving Average, while adding that “Traders were paying ~100% annualized to go long BTC early in 2021. A similar but less severe speculative market arose in the fall. Today? Funding has been flat/negative for most all of 2022.”
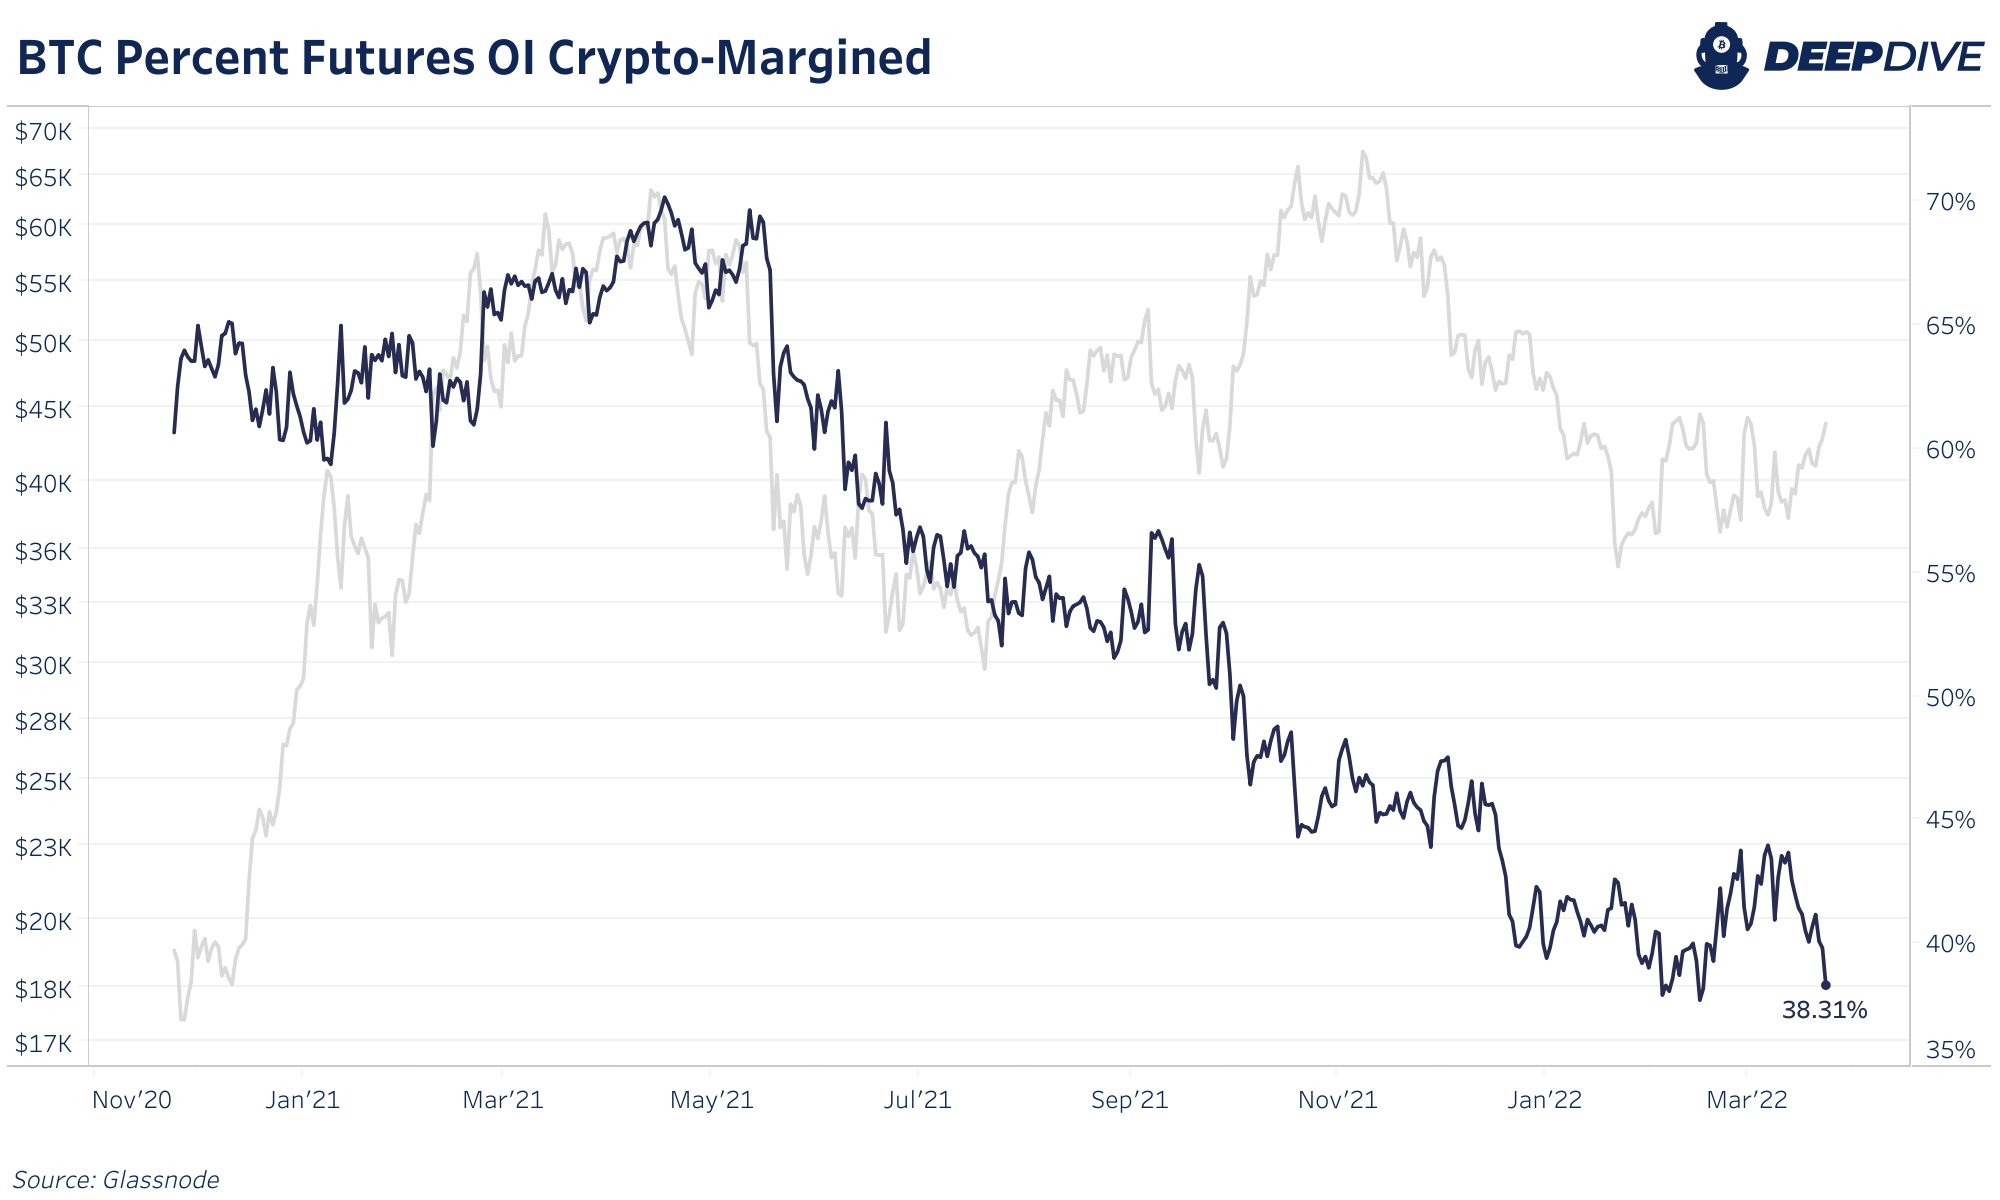
“Lastly, look at the collateral makeup of BTC derivative open interest,” LeClaire adds.
“In 2021 up to 70% of OI was collateralized with BTC. Traders were paying outrageous rates to long with BTC collateral, leading to massive liquidations. Now a majority of OI is collateralized with stables.”
Related Reading | TA: Bitcoin Saw Key Technical Breakout: Big Reaction From Bulls Imminent


